This note is a graphical account of the developments in the energy industry described in more detail here. Simple charts showing interaction between supply and demand curves on the energy market can convey most of the message. For the purposes of this note, by ‘energy market’ I mean an abstract market corresponding (with different degrees of accuracy) to aggregate oil, gas, and electricity markets in the real world.
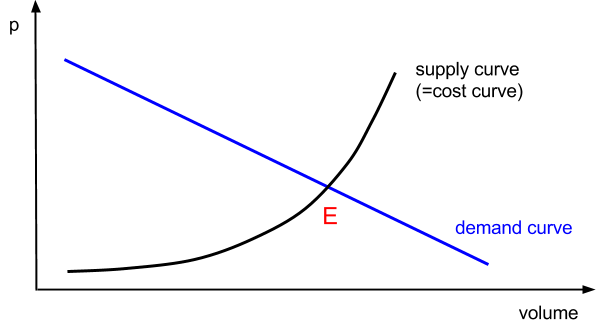
In free markets a product price is determined as a price that equalises supply and demand. Upward sloping supply curve (in price / volume coordinates) crosses downward sloping demand curve setting the equilibrium price and volume (point E in Figure 1).
The most important energy markets in the world are free markets, where such analysis is perfectly suitable.
Figure 1:
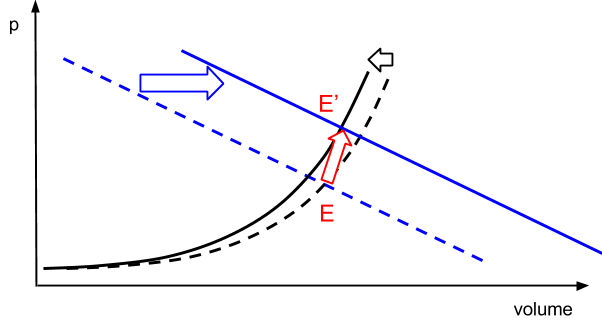
Supply and demand both have complex dynamics, making the resultant equilibrium price and volume a product of many different underlying factors. For example on the oil market dynamics over the past 20 years has been this: demand has been driven by global economy growth (especially in emerging markets) partly mitigated by increasing efficiency of oil usage, whereas supply has been restrained by the oligopoly in the low end of the cost curve (OPEC) and deteriorating geology (newly discovered resources are more expensive than the existing base being displaced). This resulted in demand curve shifting to the right and supply curve steepening, leading to higher and higher oil price as the global economy grew (shift from equilibrium E to E’ in Figure 2). Developments post the 2008 crisis (slowdown in the global growth on the demand side, and shale revolution on the supply side) have reversed the trend somewhat.
Figure 2:
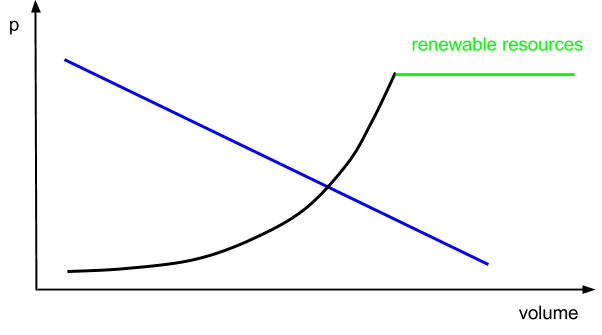
Where are renewables in this framework? They were always there as part of the supply curve sitting further to the right. Being non-competitive renewables didn’t attract much attention as they didn’t influence market price formation and didn’t take any significant market share on economic grounds (Figure 3).
Figure 3:
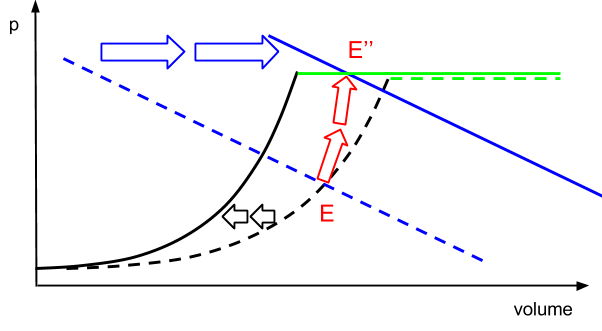
The consensus with regards to renewables (especially among the fossil fuel energy incumbents) has been the following. Renewables are expensive and will always be. But one day, a long time from now, the world running out of limited fossil fuels but staying ever hungry for energy, will eventually opt for more expensive renewable resources – the second best and the only remaining solution. In terms of the supply/demand diagrams, that would mean that the renewables part of the supply curve would eventually get closer to price/volume setting area. Renewables would become marginal producers taking non-zero market share (point E’’ in Figure 4).
Figure 4:
According to most of the incumbents, this “one day” is decades away, and certainly beyond their forecast horizons. This is for example how the world looks to BP in 2035:
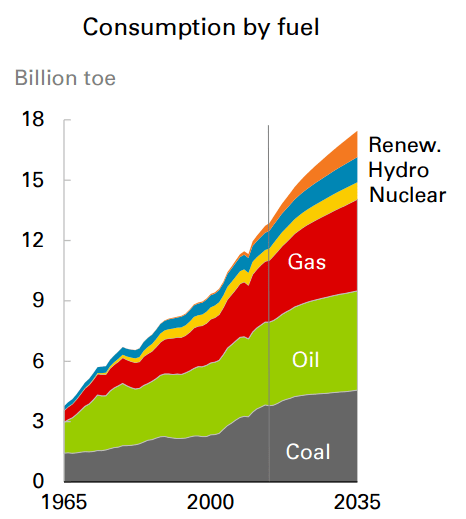
Source: BP Energy Outlook, 2015
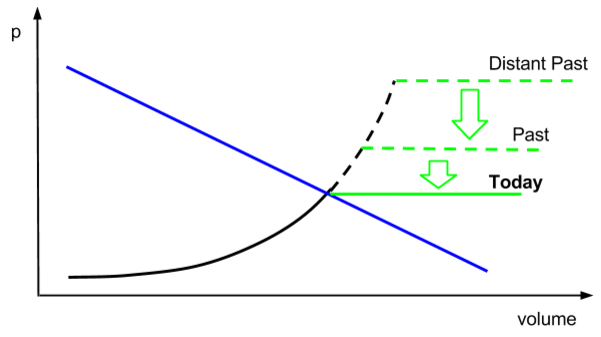
Such logic would be valid if not for a serious flaw. High cost of renewables is not a structural limitation, but rather an endogenous parameter reflecting an early stage of the new technology adoption. New technologies tend to get more efficient and less expensive over time and that certainly has been the case with renewable energy. Over time the costs went down. Initially it didn’t get noticed (the move from ‘Distant Past’ to ‘Past’ in Figure 5 below) as only non-actionable part of the supply curve got transformed. But as of today some of the alternative technologies reached cost parity with the existing ones.
Figure 5:
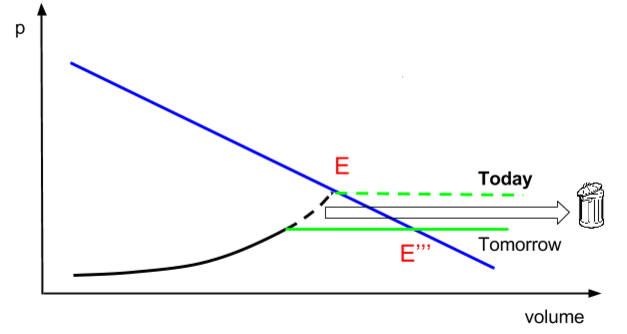
At which point it becomes actionable. Already today and more so going forward, the existing marginal producers (fossil fuels) get displaced by newly competitive alternative resources and move farther to the right on the cost curve. But for all practical purposes alternative resources (solar and wind) are unlimited (reflected in the green part of the supply curve spreading right to the infinity), thus, in the same logic as “the Stone Age came to an end not for a lack of stones” the displaced fossil fuel resources (moving farther to the right on the supply curve) effectively move to the bin. At the moment, being a marginal fossil fuel producer (deepwater / heavy / arctic oil, oil sands, etc) is a very risky business model.
Figure 6:
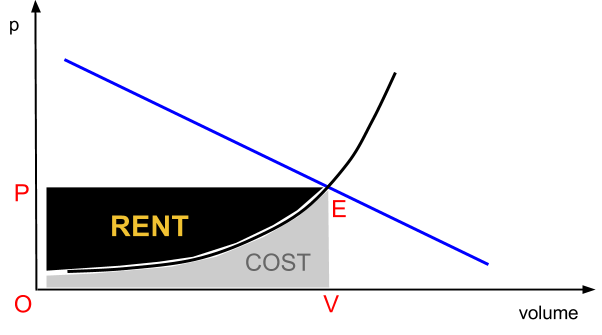
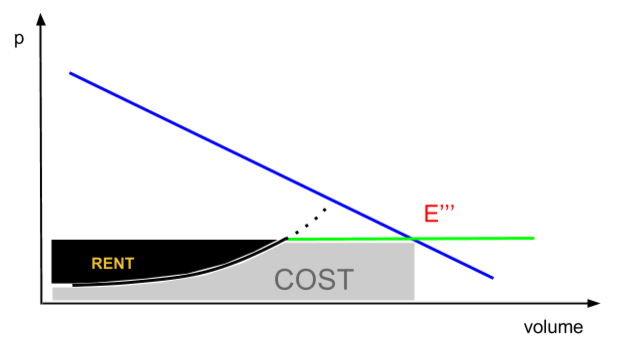
One important characteristic of a traditional supply curve is its steepness towards the right end of the curve. This is purely a geological phenomenon as easy oil in Saudi Arabia costs 5$ per barrel to extract vs. 50$ in the US. This steepness has important financial consequences. As the price on the free markets is set by the marginal producers the economic characteristics of energy business are very different in left end of the cost curve vs. the right end of the cost curve. Towards the right energy business is a high capital intensity manufacturing business with normal returns on capital; towards the left it is all about rent.
Figure 7:
On the contrary, renewables part of the supply curve is very flat. There are still more sunny and less sunny spots in the world (as well as more windy and less windy spots) but the differential is much less. Now, as renewables got cheaper the steep right end of the cost curve is being displaced by a flat one which has important implications for the rent. Energy is becoming more of a manufacturing business and less of a rent business.
Figure 8:
We are talking hundreds of billions of US dollars a year. Here is a Bloomberg’s attempt to estimate what elimination of the rent from the energy industry would mean for the international trade (with implications for relevant current accounts and currencies).
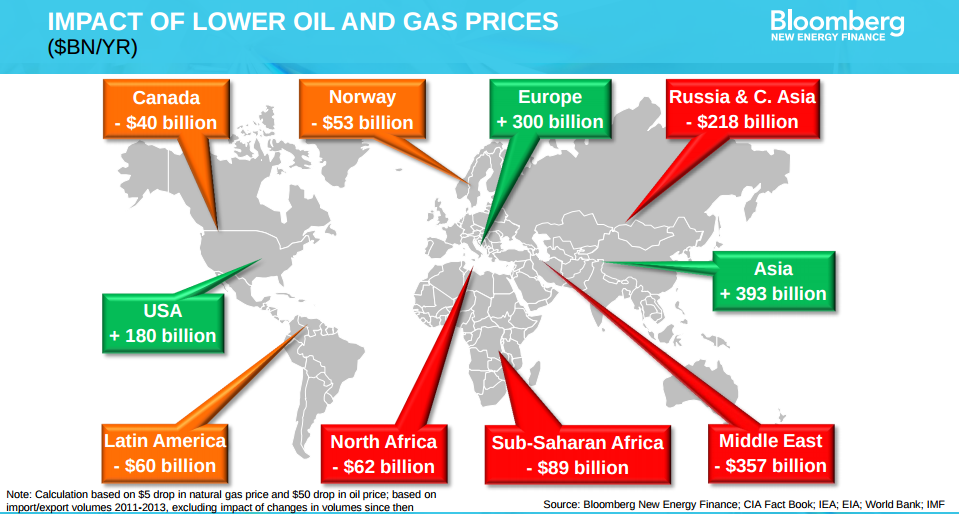
Source: BNEF
As the energy industry focus shifts from access to limited fossil fuel resources to processing unlimited alternatives, rent sharing as a principal characteristics of the energy industry economics will ultimately give way to economic characteristics more typical for technology industries. The emerging energy industry driven by technological improvements is naturally deflationary, producing undifferentiated product from unlimited and free resource. ‘Harvesting’ abundant resource with ever cheaper technology could not be more different than the current status quo. The future of the energy industry can be likened to that of the air conditioning industry. It is solid and important. But there are no great geopolitical powers based on air conditioning.
