The recent volatility on the financial markets is not your typical market volatility. In my view it is rather indicative of the ongoing shifts in the global economy. Some emerging market economies face structural challenges on their growth trajectories, whereas USA may be facing another dawn.
The list of problems typically associated with the US economy includes persistent current account deficit, persistent budget deficit, growing debt pile, and ultimately unsustainable USD, that altogether presumably undermine the whole american economic paradigm. To stay on a sustainable trajectory these factors indeed can not remain in the negative territory forever. So is there any visibility of the direction of these trends?
Current account
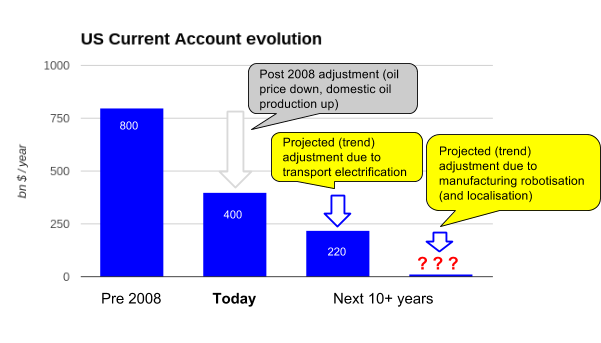
The US current account is in deficit mainly because of the two major import categories: oil import (from OPEC/etc), and manufactured goods import (from Asia/etc). Annual current account deficit went down from its peak of 800bn$/year before the 2008 crisis, and now holds at around 400bn$/year.
Current account: energy imports
A lot of adjustment on the energy side has already happened.
- Before the crisis, the US consumed 20mm bbl of oil per day, and produced 5mm bbl/day. At 100$/bbl contribution to current account deficit was (20-5)*365*100 = 550bn$/year.
- Currently US consumes roughly 20mm bbl/day, and produces almost 10mm bbl/day. At 50$/bbl the contribution to deficit is (20-10)*365*50=180bn$.
Thus, out of the total drop in current account deficit of 400bn$ (from 800bn$/year to 400bn$/year), 370bn$ (=550-180) or 92% was due to developments on the oil side (price down, domestic production up).
And the oil impact on current account adjustment is not over. On top of price and domestic production comes oil intensity story. As I argued in a note on the developments in the automotive industry, the most important ongoing change is the electrification of the powertrain. Plug-in hybrid adoption (PHEV), that has total economic sense already today, will see oil demand per vehicle drop by up to 5x, which for the overall car fleet would mean that total oil demand drops 2x before 2030 (see chart below). If in the meantime pure electric vehicles become more economic than PHEV, the effect will be even more pronounced.
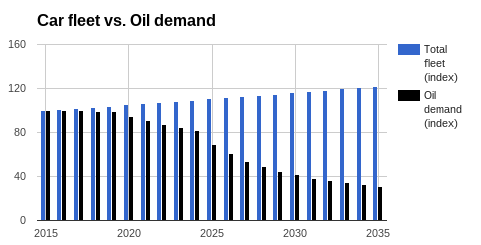
Given the current situation in the US (20mm bbl/day oil consumption, 10mm bbl/day oil production) it means that by 2030 US may stop oil imports, and the US current account deficit will reduce further by 180bn$/year (from 400bn$/year to 220bn$/year).
Current account: manufacturing imports
The contribution of manufactured good imports to the current account deficit is equally significant. While there is no single manufactured good as important as oil, given ubiquitousness of “Made in China” the aggregate impact on the current account is probably comparable.
One important ongoing development in the manufacturing industry is robotisation of the production process. For many centuries labor has been an important factor of production. In the era of globalisation cheap labor has become a significant competitive advantage driving allocation of productive capital in the last several decades (adding to current account surpluses of the countries with cheap labor while subtracting from the others’). But more recently the modern production techniques are becoming less and less labour intensive. Have a look at the new Tesla Motors auto factory built in the US (pictured below). To quote Star Wars’ 3PO this is truly machines making machines! Not too perverse though to my taste.
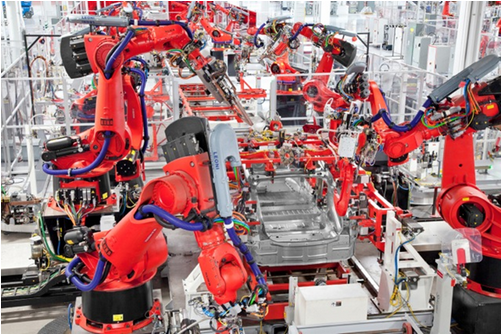
In the era or robot-manufacturing you locate your production facilities where your customer is (to save on logistics), not where the cheap labor is. Robotisation is a multi year trend, still in its relatively early stage, changing auto, electronics, even textile, and other manufacturing industries (have a look at a very good WSJ review here). In the upcoming years some of the production will move back to the US (and other high wage countries) reversing the earlier trend (and the negative impact on the current account).
I can’t help but point at the similarities in the developments in the manufacturing industry and the energy industry:
| Industry | Energy | Manufacturing |
| Old paradigm | Inflationary / Scarce fossil fuels produce marginal volumes and set market price | Inflationary / Labor-intensive manufacturing produce marginal volumes and set market price |
| Disruption | New technology (solar/wind/batteries/(PH)EV) challenge the incumbent (fossil fuels) | New technology (robotisation) challenge the incumbent (labor-intensive manufacturing) |
| New paradigm | Structurally deflationary technology driven industry | Structurally deflationary technology driven industry |
| Losers | Fossil fuel incumbents | Labor-intensive producers in low wage countries / Low skilled labor |
| Winners | The consumer | The consumer / Tech industry |
I can’t numerically estimate the ‘manufacturing reversal’ impact on the US current account. But to me it is unclear whether for a country that will increasingly produce stuff for local consumption domestically, export high value added knowledge-intensive products, and import some low value added labor-intensive products, whether for such a country manufacturing part of the current account should at all be in the negative territory.
Current account: energy imports + manufacturing imports
Putting it all together, the overall impact on the US current account is likely to be several fold decrease in the US current account deficit. Whether it should at all remain deficit is unclear to me.
Budget deficit
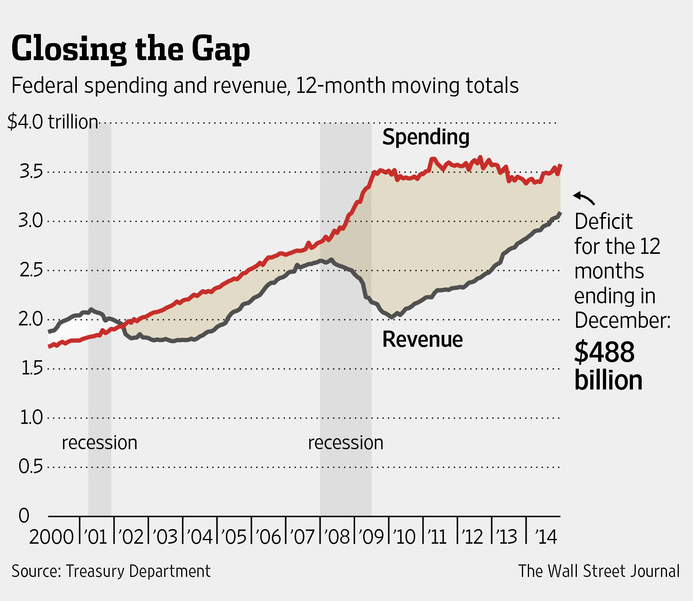
The US budget deficit has been declining from the staggering 1.5trl$/year right after the 2008 crisis, and as of Sep 2015 stands at slightly above 400bn$/year.
The current account balance and the budget deficit are closely connected through a set of macroeconomic accounting identities:
Current Account + Capital Account = 0, where Capital Account = Private Capital Account + Public Capital Account (Budget)
In the case of the US these identities mean that whatever the country sends abroad through current account deficit comes back via capital account and fulfills both the government and the private sector capital requirements:
Current Account deficit = Budget deficit + Private sector capital account balance
At the moment the US current account deficit and the budget deficit are almost equal (both stand at around 400bn$/year) which indicates that the private sector deleveraging is over and all of the current account deficit returns to finance budget deficit.
As it is clear from the identity current account deficit and budget deficit are connected, but they do not always move in line. For example, as we have seen above right after the 2008 crisis the current account deficit halved (from 800bn$/year to 400bn$/year), whereas budget deficit increased significantly (which was a consequence of private sector deleveraging matched by counter-cyclical pro-Keynesian fiscal policy of the government).
But the two often do move in line following the logic of the Twin Deficits hypothesis, that states that there is a strong link between current account balance and government budget balance. In the US the main beneficiaries of the ongoing developments in energy / manufacturing are (respectively) the consumer / the local producers:
- With consumers facing lower energy bills their disposable income increases, consumer demand goes up, economy is growing and pays higher taxes.
- In manufacturing there is a typical import substitution story. New manufacturing businesses created onshore satisfy local demand and pay new taxes.
On both sides it is clear how the projected downward trend in the US current account deficit results in the similar trend on the fiscal side. The US current account deficit and budget deficit are not two different problems but essentially one, and with the ongoing structural improvements in the former the solution to the latter is yielded automatically.
As the macro factors that served badly for the US economy are stabilising and reversing the question is what lies ahead?
Economics of knowledge
To describe economic output the economists use production functions that represent output as a function of various inputs called factors of production. The most general production function has the form:
Y = F(A, K, L)
where
Y – Output
K – Capital
L – Labour
A – measures the impact of everything else, but we concentrate on technological knowledge
Here is a brief history of relative importance of different factors of production throughout human history:
- For most of the human history L has been the principal, if not the only, production factor. The world didn’t change for centuries.
- About 200-250 years ago, at the dawn of the industrial revolution, technological progress (A) enabled transition to new manufacturing processes. Combined with capital accumulation (K) the two drove the economic progress, interrupted by wars and economic crises, ever since.
- The age of globalisation, defined by free movement of Y, K, L, and A, highlighted the differences in the costs of factors of production (primarily L) as an important competitive advantage in the global economy. Cost of L shaped a lot of movement in Y and K over the last few decades.
- Now, in the next leg of the industrial revolution brought about by A the recent importance of L fades away.
The era of globalisation doesn’t have a specific starting point, but it certainly got a boost from the collapse of the Soviet system that revealed inconsistency of the socialist economic model and left the market economy the only model to follow. Those countries not yet in the market economy camp joined the club, and on the ruins of socialism the global capitalism was born.
Having joined the club the emerging market economies naturally played a catch-up game exploiting their obvious competitive advantage (cheap labour). Despite sometimes painful transformations the end result was good for the developed economies, and expectedly very good for the emerging economies. In the modern era of global capitalism the world economy has been growing very fast, revealing a number of bottlenecks along the way (like energy which is a factor of production of its own), and creating new beneficiaries of such bottlenecks as unexpected by-product (mostly in the emerging market space as well).
There is little surprise that emerging markets have become such a dominant theme in the past several decades of global capitalism roll out. Once you are on the right track catch-up strategy is easy to implement. A catching-up economy can grow faster than the leader for a long period of time. And while there is still a lot to catch up with, some emerging economies are beginning to face difficulties as the fuel driving their growth and determining their place in the global economy (cheap labor) is being challenged not only by competition within the emerging markets, but more importantly by new technologies on the manufacturing side.
Technological progress, once again in human history, brings knowledge to the forefront making it the most important factor of production in the XXI century. What does it mean for the catchers? They need to adjust which often is a long and painful process. What does it mean for the technology leaders? They are likely to accelerate and strengthen their position. The gap between the developed economies and emerging markets has been gradually closing in the last several decades, but it is not destined to move only in one direction. With a shift in relative importance from L to A the “emerging” market of the XXI century may well be the US.
The debt
There are several ways a country can deal with its debt nominated in its own currency:
- Default
- Soft default (inflate debt away)
- Sustain (grow out of debt)
- Pay back
‘Defaults’ on debt nominated in own currencies are rare. Russia reminded in 1998 that such things happen, but much more often the countries tend to print money rather than default. Full ‘paying back’, that is when the budgets are run to pay back the debt in full, is rare as well. More common is to see the countries trying to target acceptable debt levels through a combination of ‘inflating the debt away’ (printing money to cause inflation to make real cost of debt negative), and ‘growing out of debt’ (that is when the economy is growing in nominal terms faster than the debt pile reducing debt-to-GDP ratio).
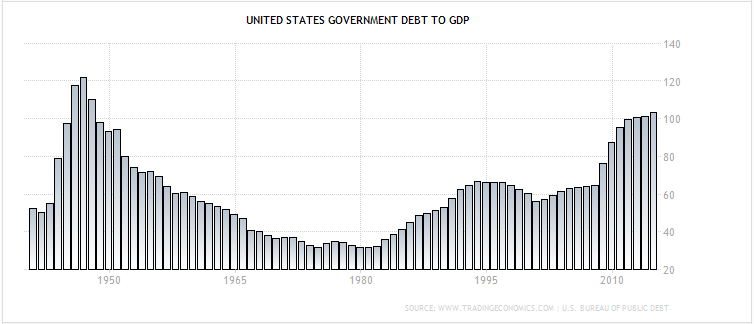
The US debt pile has risen significantly post 2008 crisis and some people believe that current levels (100%+ debt/GDP) are starting to intervene with the future growth. But as the chart below indicates the US has seen the worse post WWII, and current debt levels have already stabilised. Actually, with the current budget deficit of 400bn$/year the economy needs to grow only 2%/year (in nominal terms) to keep leverage flat. As it is growing faster the direction of the debt-to-GDP ratio has already reversed.
What can be expected going forward? If the budget deficit merely halves (following the direction of the current account) and equates 1% GDP/year, the economy accelerates moderately to 3-4%/year in real terms (which I think is a reasonable assumption for the dawn of the age of knowledge), and inflation is 2%/year, than debt-to-GDP ratio will be shrinking by 4-5 percentage points a year, eliminating any concerns about debt unsustainability before long.
The USD
Finally, the dollar. The fundamentals of everything that the US dollar is a claim on are improving. This alone is enough to stop worrying about USD sustainability.
Furthermore, supply/demand arguments actually point at the risk of US dollar appreciation:
- On the supply side, the flow of the US dollars to the rest of the world (through current account deficit) is set to shrink following the structural changes in the current account described above.
- On the demand side, the US dollar continues to be the main reserve currency. The only real contender (Chinese Yuan) has so far failed to fully eliminate capital controls and free float the currency. Furthermore, as the Chinese economy is slowing down the recent portion of the traditional medicine applied (currency devaluation) boosted capital outflows from China adding momentum to USD demand. Further reversal of USD-to-Yuan carry trade can provide significant addition to USD demand in the coming years.
As USD supply structurally shrinks, and USD demand remains intact or even temporary increases, the USD FX rate will likely continue to trend up (see chart below).
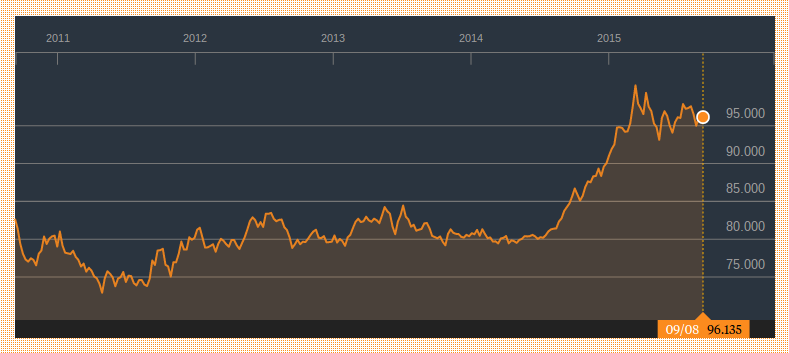
Can strong US dollar become a problem for the US economy? Not likely, at least not any time soon. First, the USD index, currently at 95, historically has seen much higher values (see chart below). All the way up to 160 (during Fed chairman Paul Volcker’s fight against inflation), and up to 120 (during dot-com euphoria). Upcoming knowledge-driven boost to the US economy can probably withstand another 10-20% rise in the USD without any significant consequences.
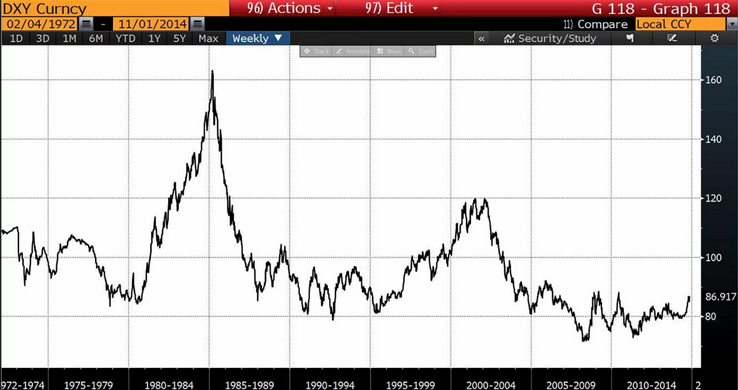
USD FX rate history (Bloomberg, Zerohedge)
But more importantly, while at the dawn of global capitalism it was easy to move a textile production facility from the US to another location with cheaper labor, it will be more difficult to export the Silicon Valley (a forefront of the US knowledge economy) and the american institutional infrastructure altogether.
The US economy demonstrated outstanding performance in the XX century which certainly will be difficult to match in the XXI. In a 2014 interview to CNBC Warren Buffett told a 58-year-old host that he will live to see the Dow Jones index at 100,000 (currently at 16,500). Effectively Buffet was calling for the next 25 year performance to surpass the pace of the XX century. Let’s wait and see.
