The purpose of this note is to estimate the likelihood, the timing and the nature of the peak oil scenario on the US oil market.
Brief history of peak oil
Oil market (=oil consumption, =oil production) has been growing since the first oil well was drilled in the XIX century. In the mid XX century, reflecting the limited total amount of oil reserves available and ever growing oil production, the concept of “peak oil” was introduced – a moment in time originally expected in around 1970 in the US and later on elsewhere – when oil production would begin to structurally decline, as new oil from the new oil fields would not be enough to compensate for the lost volumes, due to depletion of the traditional fields.
More oil discoveries than expected in the XX century, and shale revolution in the early XXI century, moved the expected peak oil day further into the future.
Peak oil has always been considered to be peak oil supply, but with another development of the XXI century – exponential progress in the renewable energy technologies – an alternative view of peak oil demand emerged.
Uncertainty about peak oil is about the date. Energy traditionalists believe in peak oil supply in about 50-plus years from now, and renewable energy proponents expect peak oil demand in about 20-minus years. Who is right?
The ingredients: fleet growth, fleet replacement, fuel efficiency
For the purposes of the analysis below, we consider a single major market – the US market. When the US market turns, the global economy will follow. (The complete analysis would either study the dynamics of all 200 countries, or, still reasonably complete, study the dynamics of a major emerging market – China – and claim that the global dynamics would be in between the two).
Also, for the purposes of the analysis below, we consider the single most important use of oil – the automotive industry.
There are three main components affecting oil demand in the automotive industry: growth in the overall miles driven, ongoing replacement of old (less fuel efficient) vehicles with new (more fuel efficient) vehicles and expected future dynamics of the fuel efficiency.
Growth in miles driven
The US new car market, as well as the total fleet size, have been growing at around 1% a year on average (EPA Report for CO2 and Fuel Economy Trends, 2018, Table 2.1).
Assuming that driving patterns remain intact (average miles driven per car stays the same), the overall oil demand in the automotive sector, due to the increase in the fleet size, is likely to grow at the same 1% a year rate.
Vehicle replacement
Average age of a car on the US streets is about 11.5 years, which means the average car serves for 23 years from production to phasing out, so that the new cars produced in 2018 replace the older cars produced around 1995.
In the next ten years the overall fleet fuel efficiency will be driven by two factors: new, more efficient vehicles joining the fleet between 2018 and 2028; and the older ones, produced between 1995 and 2005, being decommissioned.
While we leave the discussion of the former until the next section, one thing to note about the latter is the dynamics of fuel efficiency, measured as miles-per-gallon (MPG), between 1995 and 2005 – as the curve was downward sloping at the time (see Chart 1), overall fleet fuel efficiency will constantly improve in the next decade, even if the progress in new vehicles’ efficiency stalled.
Chart 1: US fuel economy dynamics (MPG), new models
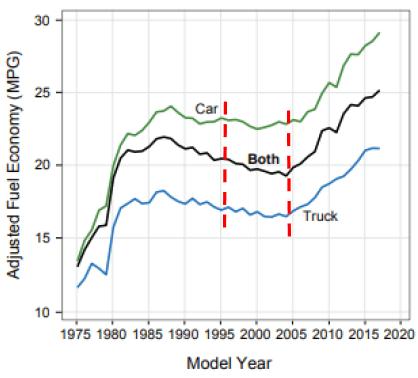
Source: US EPA
Future fuel efficiency
Fuel efficiency of new models has been steadily rising by 1% a year on average (EPA Report for CO2 and Fuel Economy Trends, 2018, Table 2.1) due to small technical improvements in design of the internal combustion engine (ICE). It seems though, that the future may favour a totally different way to improve ICE fuel efficiency further.
Norway, from 2012 onwards, presented an interesting case study. Tesla Model S, a fully electric sedan, was launched in 2012 in the US and reached Norway soon after. A high quality premium vehicle – the only one to have received 100 out of 100 score from Consumer Reports – found itself in an unusual position in Norway, competing in the mid market niche due to heavy duties on imported internal combustion engine (ICE) cars in Norway. Better quality, at market average price, resulted in exponential adoption (Chart 2), with the EV market share growing from low single digits in 2012, to almost 40% in 2018.
Chart 2: Norway’s experience. Exponential growth of EV (and Plug-in hybrid) penetration after premium quality entrant hits the market at mid market price.

Source: BNEF
Apparently, Norway’s EV adoption finally, 5 years after the introduction of Tesla Model S to the Norwegian market, starts to affect the oil demand. Total sales of petroleum products in Norway in 2017 dropped more than 2 percent versus the previous year. Peak oil demand has already come to Norway.
What Tesla Model S (and Nissan LEAF) is for Norway, Tesla Model 3 – a new electric sedan launched in 2017 in the US – may be for the vast American market. The new vehicle is high quality, half the price of Tesla Model S and targets the US mid market.
Chart 3: Tesla Model 3 production. Is Tesla Model 3 for the US what Tesla Model S was for Norway?

Source: Bloomberg
US (Model 3, 2017 onwards) vs. Norway (Model S, 2012 onwards)
While it is too early to compare the dynamics of the EV adoption curves in Norway and the US, we can compare the differences and similarities of the two situations.
#1. In both cases, a superior quality electric vehicle entered the market at mid market price.
Outcome: Favours Norway’s scenario.
#2. Mid market price in Norway (2012) was due to heavy import duties on ICE cars. Mid market price in the US (2017) is a result of continuing structural technological deflation of electric batteries and EV assembly costs.
Outcome: More sustainable grounds than in Norway in 2012. Favours Norway’s scenario.
#3. EV charging infrastructure is building up, and is a lesser bottleneck for EV adoption.
Outcome: Favours Norway’s scenario.
#4. Norway is a small market, the adoption curve reflects limitations only on the demand side (mind shift). US is a large market, the adoption curve will reflect limitations on both the demand side and the supply side (capacity constraints).
Outcome: Tesla’s capacity constraints may slow EV adoption in the US, compared to Norway’s scenario, but other producers will probably fill the gap.
All in all, capacity constraints may be a source of delays in the US, relative to the speed of EV adoption in Norway, but rarely in history have temporary constraints on the manufacturing side seriously impacted the timing, let alone the final outcome of the transformation.
All major auto producers have announced plans to roll out EV/plug-in-hybrid models, and they might want to act quickly, as traditional producers are already starting to lose the market share in the US. For example, BMW North America reported sales volumes for August 2018 are down 13.5% year-on-year in the passenger car segment. EV adoption has become an existential threat and existential challenge, for the mainstream auto producers. Peak new ICE passenger car in the US has already happened.
Scenarios
We consider 3 scenarios of oil demand dynamics in the US in the next 10 years. In all scenarios, we assume that the new car market and the car fleet continue to grow at 1% a year, the new more fuel efficient cars replace the less fuel efficient ones, but the fuel efficiency of the new cars varies depending on the scenario (see the model).
In Scenario 1 we assume that fuel efficiency progress stalls completely.
In Scenario 2 we assume that fuel efficiency continues to follow the multiyear trend – improve by 1% a year. (Both scenarios effectively assume no significant impact of EV on the auto market).
In Scenario 3 we model Norway’s scenario. The share of EVs on the new car market would increase by 5 percentage points every year (roughly what we have seen in Norway since 2012), reaching 50% in 10 years. Such dynamics of EV adoption would correspond to a 5% a year increase in MPG of the new cars. If historically improvements in MPG have been driven by improvements in ICE design, in Norway’s scenario, the main driver is electrification of the fleet and elimination of ICE.
Scenario 1: Fuel efficiency progress stalls (0%)

Scenario 2: Fuel efficiency progress as historically (1%)

Scenario 3: Fuel efficiency progress as in Norway’s ICE replacement scenario (5%)
Conclusion
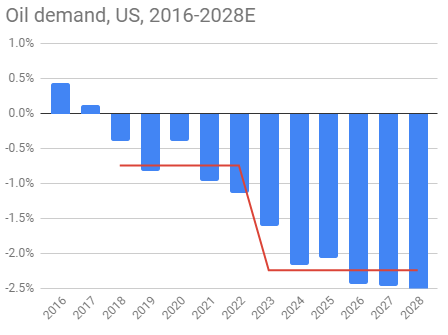
One interesting observation is that even in the most conservative scenario (Scenario 1) US oil demand growth is balancing around zero (with negative sign) in 2018E-2023E, and drops further to -0.5% a year in 2023E-2028E, due to a sharp difference between fuel efficiency of the new cars relative to fuel efficiency of the older cars (Chart 1).
In things-as-usual scenario (Scenario 2), negative growth in oil demand is becoming more pronounced, reaching around -1% a year in the second half of the upcoming decade.
In scenario 3 (Norway’s scenario), when ICE replacement with EV is added on top of the substantial ongoing improvement in fuel efficiency of the ICE fleet, oil demand disaster – US oil demand falling faster than by 1% a year – is less than 5 years from now.
In all three scenarios, the surprise year looks to be 2018E, and even more so 2019E. Peak oil demand in the US seems to be now.
Our bet is on the US actual curve to somewhat lag the Norway curve, and China’s curve to lag the US curve, leaving the global curve (whose dynamics would be in between the US and China), somewhat behind the US.
As US peak oil is about now, global peak oil is only a few years away.
